Method natural frequency tree
No test is ever perfect – How reliable is intraocular pressure measurement for early detection of glaucoma?
Before consumers make decisions, they usually gather information. Therefore, they read certain magazines, for example, to find out how well a product has scored in a test. In the health sector, however, consumers often do a test first in order to have a basis for a decision, e.g. on whether to change their diet. But also beyond the health sector, more and more tests and prognostic tools are being used, e.g. algorithms for decision support. An example would be Robo-advisors that make recommendations for the decision on which type of loan you should take out. The problem is that there is no perfect test, no perfect algorithm, and no perfect model. This means that the statement, the result or the recommendation given by a test or algorithm can always be wrong.
Why is it relevant to support consumer decisions on the basis of tests and algorithms?
The increasing spread of diagnostic and predictive tests and algorithms in the health sector, particularly for consumers who are not at all affected by the respective disease, represents a highly lucrative business field for the developers of these tests and algorithms. Earlier detection or even the prediction of future diseases are powerful purchasing arguments. In addition, products with algorithmic prediction models for decision support are developed in all other areas of life. However, since all tests or algorithms can produce false results, the question always arises whether they are at least reliable enough before purchase or use.
Why is it problematic to support consumer decisions on the basis of tests and algorithms?
Obstacles for an informed use of tests and algorithms lie in the lack of awareness of their limited reliability, in the lack of knowledge about where key information can be found, but also in the limited opportunities to be willing and able to deal with such statistical questions. A test is always an "observation" of reality, which always raises the question: If the test makes an observation, how likely is it to be correct? This conditional probability requires a consumer-friendly approach.
Natural Frequency Trees (NFTs) allow an improved understanding of conditional probabilities, particularly in comparison to Bayesian formula calculations and unstructured text tasks (McDowell & Jacobs, 2017). It is important for NFTs that consistent subsets of a single base quantity (initial group) in the form of frequencies are used. It is not normalised or converted. Instead, the simple frequencies can be combined in their dependencies in such a way that the conditional probabilities can be easily determined (Gigerenzer & Hoffrage, 1995; Hoffrage & Gigerenzer, 1998). In this way, the use of the Bayesian formula is no longer necessary. It has been shown that even primary school students can use NFT training to make Bayesian conclusions and better calculate how likely it is that a test result is to be true (Zhu & Gigerenzer, 2006).
NFTs show - beginning with a fictitious group - how often something that the test is looking for or that the algorithm wants to predict occurs (see example below). In other words: How many people are actually affected? At the same time, it is contrasted how often it does not occur (unaffected people).
For each of these subgroups (those affected and those not affected), it is recorded separately how many times the test or algorithm detects those affected and how many of those not affected receive a false alarm. A false alarm occurs when a non-affected person receives an alert, although the test or algorithm should stay silent.
For each of the subgroups (those affected and those not affected), it is also recorded separately how many times the test or algorithm "remains silent", i.e. how many of those not affected correctly do not receive an alert. However, it is also important to ask how many of those affected are overlooked if the test or algorithm stays silent although it should detect them.
Consumers then receive the most important information if they only look at those subgroups for which the test or algorithm issues an alert. They can now see how many of those alerted are actually affected. This is also called positive predictive value (PPV). Hence, the user knows in advance how likely it is that a test or algorithm is going to be correct. They can then consider whether it is worth using it.
Natural frequency trees allow consumers to check the positive predictive value of tests and thus their reliability, e.g. if they are offered as an individual health service (known as "IGeL" services). Consumers can also test the reliability of tests that they can purchase directly (in retail shops) or via the Internet (Direct2Consumer area). In addition, natural frequency trees allow citizens to address key questions to organisations with algorithms that influence decisions - and to check them: How often does the search occur, how many are recognised, how many are overlooked, how many are exonerated, how many are falsely alerted?
How to construct a natural frequency tree?
A. What do you need?
For the evidence-based development of Natural Frequency Trees (NFTs) for your own questions, you need three key pieces of information: how often the feature you are looking for is present (prevalence of the feature if it is about all affected persons; incidence of the feature if it is only about new discoveries), how many of the feature carriers or affected people are detected (sensitivity of the test), and how many of the non-feature carriers or not affected people would be correctly cleared (specificity of the test).
B. How do you proceed?
Regarding health questions, it is recommended to research the information (prevalence or incidence, sensitivity, specificity) using services offered by established organizations of evidence-based medicine (e.g. www.igel-monitor.de, www.gesundheitsinformation.de), unless you have your own medical service or public health department. This procedure should be applied before proceeding to a systematic scientific literature search.
This scientific research should be orientated towards avoiding a review of your own. This would require at least two staff members with experience in the area of systematic search and health science, who would then prepare a summary (also statistically) of published studies. Instead, you should search exclusively via www.cochrane-library.org or www.ncbi.nlm.nih.gov/pubmed/ for Cochrane Reviews or systematic reviews for your own research question.
Outside the health sector, the evidence-based appraoches are rather fragmented. Exceptions are www.campbell-collaboration.de (political measures), whatworks.college.police.uk (crime) and educationendowmentfoundation.org.uk (education). The evidence base will be very difficult to determine, particularly for questions of algorithmic tests and prognostic tools. This is structurally related to the fact that neither requirements nor supervision as with medical products are required so far. The frequency with which the sought-after feature occurs can be determined by research independently of the algorithm. However, the information on sensitivity ("recall" in the language of developers) and specificity or false alarms (also fall-out), usually require a direct exchange with developers. If you want to develop your own model, please consult the final report on the Risk Atlas project from July 2020 or contact us. Contact details can be found here.
- Gigerenzer, G., & Hoffrage, U. (1995). How to improve Bayesian reasoning without instruction: Frequency formats. Psychological Review, 102(4), 684.
- Hoffrage, U., & Gigerenzer, G. (1998). Using natural frequencies to improve diagnostic inferences. Academic Medicine, 73(5), 538–540.
- McDowell, M., & Jacobs, P. (2017). Meta-analysis of the effect of natural frequencies on Bayesian reasoning. Psychological Bulletin, 143(12), 1273–1312.
- Zhu, L., & Gigerenzer, G. (2006). Children can solve Bayesian problems: The role of representation in mental computation. Cognition, 98(3), 287–308.
If you would like to adopt a consumer topic from our website, you can do so in the following three ways:
- You are using a digital copy. Either you directly save an illustration or download our PDF, or you integrate the illustration via Link(a href) or iframe.
- You take your analogue copy and print out our PDF. The resolution and vector-based graphic is suitable for posters and brochures.
- You recommend the app and refer to the Risikokompass from the PlayStore and AppStore.
If you would like to develop your own model, please consult the final report on the RiskAtlas project from July 2020 or contact us. Contact details can be found here.
When using the instruments, please mention the funding agency, which is the German Federal Ministry of Justice and Consumer Protection, and the Harding Centre for Risk Literacy as the responsible developers.
Logos can be downladed here.
No test is ever perfect – How reliable is intraocular pressure measurement for early detection of glaucoma?
Glaucoma is an eye disease that damages the optic nerve. In extreme cases, the disease can lead to blindness. It is understandable that this causes concern. Some ophthalmologists will offer to perform an intraocular pressure measurement (tonometry) for comfort and early detection of glaucoma. This preventive examination with consultation costs between 10 and 22 euros. But can you trust the test result? Most people with increased intraocular pressure do not develop glaucoma. Moreover, in one to two out of four glaucoma patients no increased intraocular pressure was detected. So how can you assess the reliability of such a test? With our frequency tree you can see for yourself.
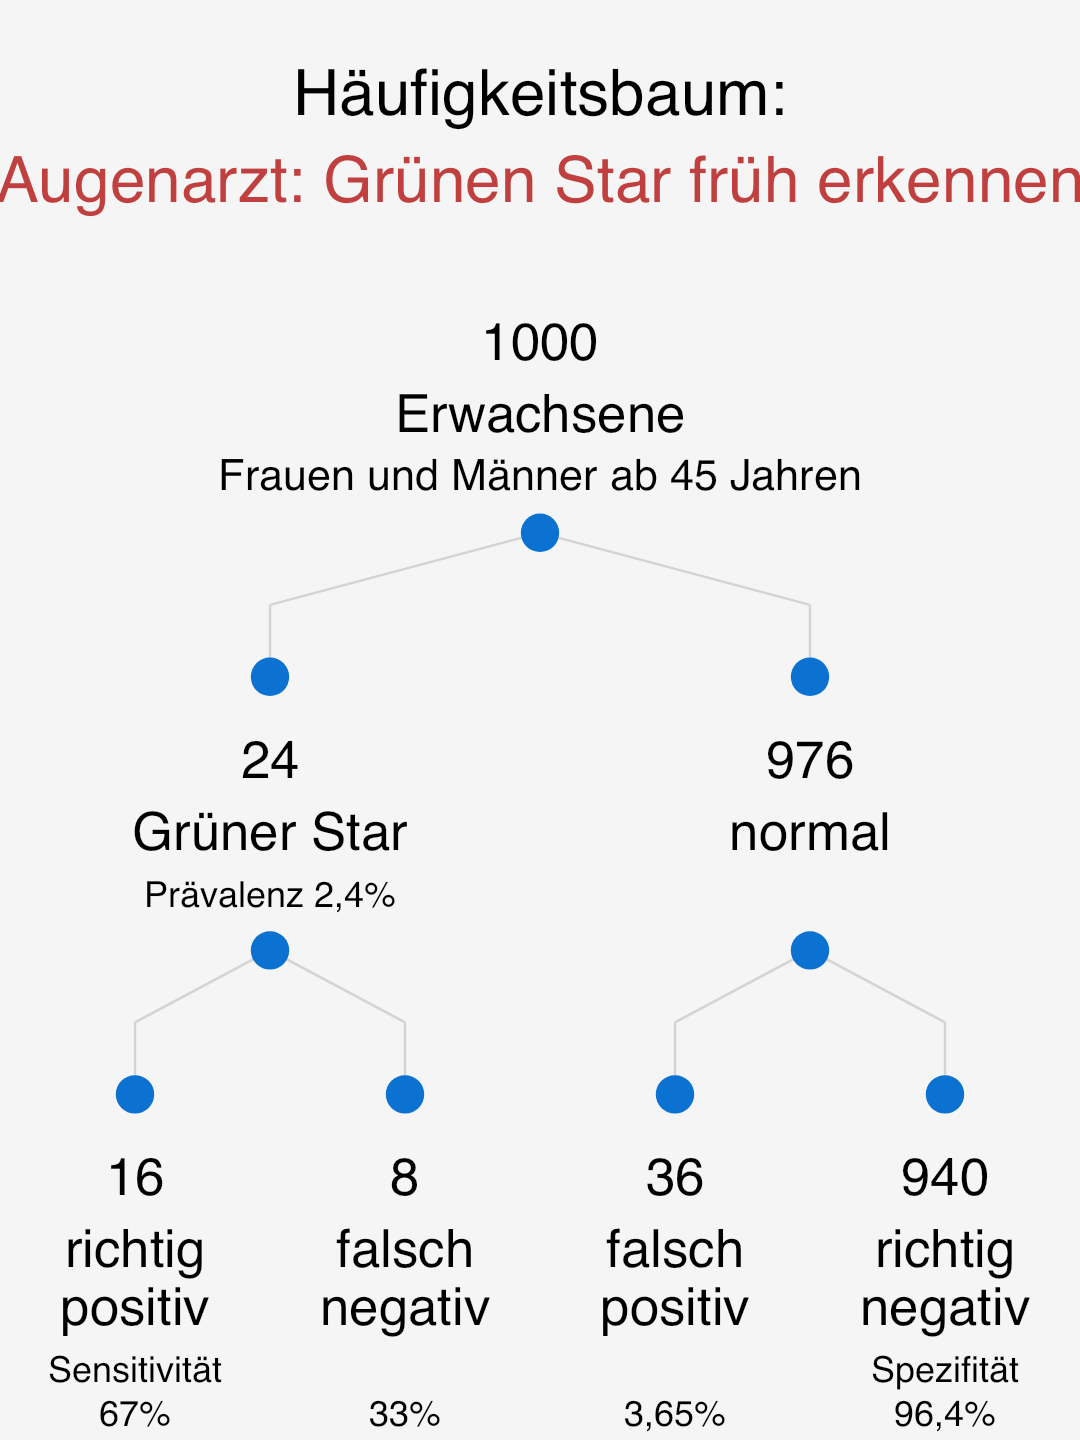
How to read this figure?
Among 1,000 women and men aged 45 and over, 24 have a recognised or previously unrecognised glaucoma on a given date.
Of these 24, 16 are detected due to the intraocular pressure measurement's sensitivity of 67% (in fact this fluctuates between 40% and 90%). At the same time, however, 36 men and women who do not have glaucoma still receive a critical measurement result, which needs to be examined further.
This means that 16 of all those who have an abnormal result (16 + 36) actually have glaucoma. Simplified: 16 of 52 critical results. This corresponds to a positive predictive value of 31% (=16/52).
The probability that the intraocular pressure measurement is correct when it indicates glaucoma is 31%. Please decide for yourself whether this and the resulting examination is beneficial for you.
The IGeL-Monitor of individual health services such as intraocular pressure measurement tends to evaluate the intraocular pressure measurement as a self-payer service rather negatively. The reason is that no reliable prediction is guaranteed, side effects occur and examinations can always also impair the patients' quality of life.
Source of the proposed prevalence value:
Marx-Gross (2017). Deutsches Ärzteblatt International, 114(12), 204.
Source of the proposed sensitivity and specificity values:
IGeL-Monitor (2012). Ergebnisbericht Messung des Augeninnendrucks zur Früherkennung eines Glaukoms.
Own calculation of the mean value of the given range.
Empirical evaluation with consumers
All research results on the fundamentals and on the effectiveness of the RiskoAtlas tools in terms of competence enhancement, information search and risk communication will be published together with the project research report on 30 June 2020. If you are interested beforehand, please contact us directly (Felix Rebitschek, rebitschek@mpib-berlin.mpg.de).
Herzerkrankungs-EKG
Diabetes-Test HbA1c
Hirnleistungscheck
Streptokokken-Test für Schwangere
Toxoplasmose